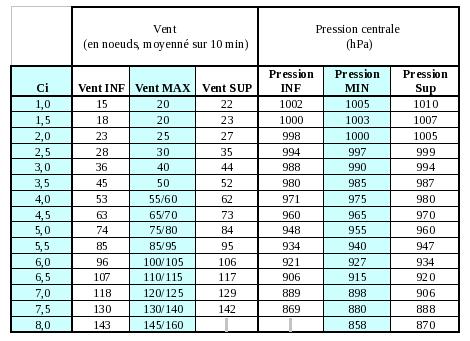
Relationship between Ci, maximum wind and central pressure used at the RSMC La Reunion
H1) What is the Dvorak technique and how is it used?
H2) What's it like to go through a hurricane
on the ground ? What are the early warning signs of an approaching
tropical cyclone ?
H3) How does the ocean respond to a hurricane and how does this feedback to the storm itself?
H4) Who are the "Hurricane Hunters" and what are they looking for?
H5) What is it like to fly into a hurricane?
H6) Are there hurricanes on other planets ?
Contributed by Chris Landsea, adpated by Anne-Claire Fontan
The Dvorak technique is a methodology to get estimates of tropical cyclone intensity from satellite pictures. Vern Dvorak developed the scheme using a pattern recognition decision tree in the early 1970s (Dvorak 1975, 1984) .
Utilizing the current satellite picture of a tropical cyclone, one matches the image versus a number of possible pattern types: Curved band Pattern, Shear Pattern, Eye Pattern, Central Dense Overcast (CDO) Pattern, Embedded Center Pattern or Central Cold Cover Pattern. If infrared satellite imagery is available for Eye Patterns (generally the pattern seen for hurricanes, severe tropical cyclones and typhoons), then the scheme utilizes the difference between the temperature of the warm eye and the surrounding cold cloud tops. The larger the difference, the more intense the tropical cyclone is estimated to be. From this one gets a "T-number" and a "Current Intensity (CI) Number". CI numbers have been calibrated against aircraft measurements of tropical cyclones in the Northwest Pacific and Atlantic basins. On average, the CI numbers correspond to the following intensities:
| CI Number | Maximum Sustained
One Minute Winds (kts) |
Central Pressure (mb) |
|
| Atlantic | NW Pacific | ||
| 0.0 | < 25 | ---- | ---- |
| 0.5 | 25 | ---- | ---- |
| 1.0 | 25 | ---- | ---- |
| 1.5 | 25 | ---- | ---- |
| 2.0 | 30 | 1009 | 1000 |
| 2.5 | 35 | 1005 | 997 |
| 3.0 | 45 | 1000 | 991 |
| 3.5 | 55 | 994 | 984 |
| 4.0 | 65 | 987 | 976 |
| 4.5 | 77 | 979 | 966 |
| 5.0 | 90 | 970 | 954 |
| 5.5 | 102 | 960 | 941 |
| 6.0 | 115 | 948 | 927 |
| 6.5 | 127 | 935 | 914 |
| 7.0 | 140 | 921 | 898 |
| 7.5 | 155 | 906 | 879 |
| 8.0 | 170 | 890 | 858 |
A relationship between Ci, maximum winds and central pressure has been defined for the Southwest Indian Ocean, from measurements in the Northwest Pacific:
Note that this estimation of both maximum winds and central pressure assumes that the winds and pressures are always consistent. However, since the winds are really determined by the pressure gradient, small tropical cyclones (like the Atlantic's Andrew in 1992, for example) can have stronger winds for a given central pressure than a larger tropical cyclone with the same central pressure. Thus caution is urged in not blindly forcing tropical cyclones to "fit" the above pressure- wind relationships. (The reason that lower pressures are given to the Northwest Pacific tropical cyclones in comparison to the higher pressures of the Atlantic basin tropical cyclones is because of the difference in the background climatology. The Northwest Pacific basin has a lower background sea level pressure field. Thus to sustain a given pressure gradient and thus the winds, the central pressure must accordingly be smaller in this basin.)
The errors for using the above Dvorak technique in comparison to aircraft measurements taken in the Northwest Pacific average 10 mb with a standard deviation of 9 mb (Martin and Gray 1993). Atlantic tropical cyclone estimates likely have similar errors. Thus an Atlantic hurricane that is given a CI number of 4.5 (winds of 77 kt and pressure of 979 mb) could in reality be anywhere from winds of 60 to 90 kt and pressures of 989 to 969 mb. These would be typical ranges to be expected; errors could be worse. However, in the absence of other observations, the Dvorak technique does at least provide a consistent estimate of what the true intensity is.
While the Dvorak technique was calibrated for the Atlantic and Northwest Pacific basin because of the aircraft reconnaissance data ground truth, the technique has also been quite useful in other basins that have limited observational platforms. However, at some point it would be preferable to re-derive the Dvorak technique to calibrate tropical cyclones with available data in the other basins.
Lastly, while the Dvorak technique is primarily designed to provide
estimates of the current intensity of the storm, a 24 h forecast of the
intensity can be obtained also by extrapolating the trend of the
CI number. Whether this methodology provides skillful forecasts is
unknown.
Contributed by Neal Dorst
Just as every person is an individual, every hurricane is different. So every experience with such a storm will be unique. The summary below is of a general sequence of events one might expect from a Category 2 hurricane approaching a coastal area. What you might experience could be vastly different.
Contributed by Joe Cione
The ocean's primary direct response to a hurricane is cooling of the sea surface temperature (SST). How does this occur? When the strong winds of a hurricane move over the ocean they churn-up much cooler water from below. The net result is that the SST of the ocean after storm passage can be lowered by several degrees Celsius (up to 10° Fahrenheit).
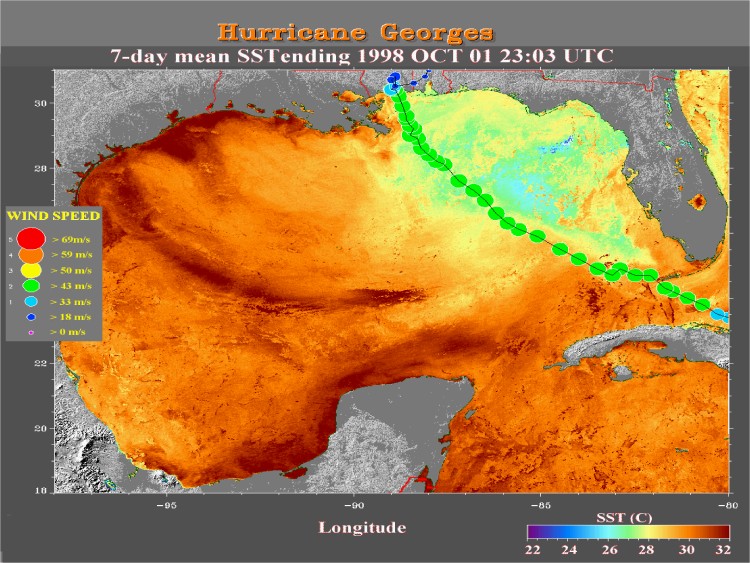 Figure 1 shows SSTs ranging between 25-27°C (77-81°F)
several days after the passage of Hurricane Georges in 1998. As
Figure 1 illustrates, Georges' post storm 'cold wake' along
and to the right of the superimposed track is 3-5°C (6-9°F)
cooler than the undisturbed SST to the west and south (i.e. red/orange regions are ~30°C [86°F]). The magnitude and distribution of the cooling pattern shown in this illustration is fairly typical for a post-storm SST analysis.
Figure 1 shows SSTs ranging between 25-27°C (77-81°F)
several days after the passage of Hurricane Georges in 1998. As
Figure 1 illustrates, Georges' post storm 'cold wake' along
and to the right of the superimposed track is 3-5°C (6-9°F)
cooler than the undisturbed SST to the west and south (i.e. red/orange regions are ~30°C [86°F]). The magnitude and distribution of the cooling pattern shown in this illustration is fairly typical for a post-storm SST analysis.
One important caveat to realize however is that most of the 3-5°C (6-9°F) ocean cooling shown in Figure 1
occurs well after the storm has moved away from the region (in this
case several days after Georges made landfall). The amount of ocean cooling that occurs directly beneath the hurricane within the high wind region of the storm is a much more important question scientists would like to have answered. Why? Hurricanes get their energy from the warm ocean water beneath them. However, in order to get a more accurate estimate of just how much energy is being transferred from the sea to the storm, scientists need to know ocean temperature conditions directly beneath the hurricane. Unfortunately, with
150kph+ (100mph+) winds, 20m+
(60ft+) seas and heavy cloud cover being the norm in this region of
the storm, direct (or even indirect) measurement of SST conditions
within the storm's "inner core" environment are very rare.
Thankfully in this case "very rare" does not mean "once in a
lifetime". Recently, scientists at the Hurricane Research Division
were able to get a better idea of how much SST cooling occurs directly
under a hurricane by looking at many storms over a 28 year period. By
combining these rare events, HRD scientists put together a "composite
average" of ocean cooling directly under the storm.
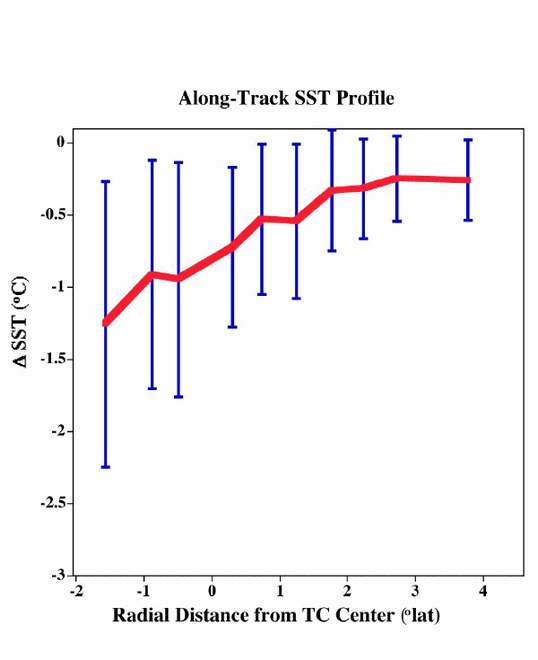 Figure 2 illustrates that, on average, cooling
patterns are a lot less than the post storm 3-5°C (6-9°F)
cold wake estimates shown in Figure 1. In most cases, the ocean
temperature under a hurricane will range somewhere between 0.2 and
1.2°C (0.4 and 2.2°F) cooler that the surrounding ocean
environment. Exactly how much depends on many factors including
ocean structure beneath the storm (i.e. location), storm speed,
time of year and to a lesser extent, storm intensity (Cione and
Uhlhorn 2003).
Figure 2 illustrates that, on average, cooling
patterns are a lot less than the post storm 3-5°C (6-9°F)
cold wake estimates shown in Figure 1. In most cases, the ocean
temperature under a hurricane will range somewhere between 0.2 and
1.2°C (0.4 and 2.2°F) cooler that the surrounding ocean
environment. Exactly how much depends on many factors including
ocean structure beneath the storm (i.e. location), storm speed,
time of year and to a lesser extent, storm intensity (Cione and
Uhlhorn 2003).
While the estimates in Figure 2 represent
a dramatic improvement when
it comes to more accurately representing actual SST cooling patterns
experienced under a hurricane, even small errors in inner core SST can
result in significant miscalculations when it comes to accurately
assessing how much energy is transferred from the warm ocean
environment directly to the hurricane. With all other factors being
equal, being "off" by a mere 0.5°C (1°F) can be the difference
between a storm that rapidly intensifies to one that falls apart!
With that much at stake, scientists at HRD and other government and
academic institutions are working to improve our ability to accurately
estimate, observe and predict "under-the-storm" upper ocean conditions.
These efforts include statistical studies, modeling efforts and
enhanced observational capabilities designed to help scientists better
assess upper ocean thermal conditions under the storm. With such
improvements, it is believed that future forecasts of tropical cyclone
intensity change will be significantly improved.
Reference
Cione, J. J., and E. W. Uhlhorn, 2003: Sea Surface Temperature
Variability in Hurricanes: Implications with Respect to Intensity
Change. Monthly Weather Review, 131, 1783-1796.
Contributed by Neal Dorst
In the Atlantic basin (Atlantic Ocean, Gulf of Mexico, and Caribbean Sea) and in the eastern and central Pacific, as required, hurricane reconnaissance is carried out by two government agencies
The U.S. Navy stopped flying hurricanes in 1974.

The 53rd WRS is based at Keesler AFB in Mississippi and maintains a fleet of ten WC-130 planes. These cargo airframes have been modified to carry weather instruments to measure wind, pressure, temperature and dew point as well as drop instrumented sondes and make other observations.

AOC is presently based at MacDill AFB in Tampa, Florida and among its fleet of planes has two P-3 Orions, originally made as Navy sub hunters, but modified to include three radars as well as a suite of meteorological instruments and dropsonde capability. Starting in 1996 AOC added to its fleet a Gulfstream IV jet that is able to make hurricane observations from much higher altitudes (up to 45,000 feet). It is used primarily to drop sondes around the hurricane's environment to measure synoptic-scale parameters in the usually data-free oceanic areas.
The USAF planes are the workhorses of the hurricane hunting effort. They are often deployed to a forward base, such as Antigua, and carry out most of the reconnaissance of developing waves and depressions. Their mission in these situations is to look for signs of a closed circulation and any strengthening or organizing that the storm might be showing. This information is relayed by satellite to the OAR for the hurricane specialists to evaluate.
The NOAA planes are more highly instrumented and are generally reserved for when developed hurricanes are threatening landfall, especially on U.S. territory. They are also used to conduct scientific research on storms.
The planes carry between six to fifteen people, both the flight crew and the meteorologists. Flight crews consist of a pilot, co-pilot, flight engineer, navigator, and electrical technicians. The weather crew might consist of a flight meteorologist, lead project scientist, cloud physicist, radar specialist, and dropsonde operators.
The primary purpose of reconnaissance is to track the center of circulation, these are the co-ordinates that the National Hurricane Center issues, and to measure the maximum winds. But the crews are also evaluating the storm's size, structure, and development and this information is also relayed to NHC via radio and satellite link. Most of this data, which is critical in determining the hurricane's threat, cannot be obtained from satellite.
Contributed by Chris Landsea

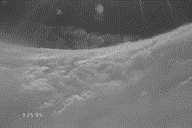
The most incredible sight that I've ever seen is in the middle of a strong hurricane. One might not believe this, but most hurricane flights are fairly boring. They last 10 hours, there are clouds above you and clouds below - so all you see is gray, and you don't feel the winds swirling around the hurricane.

But what does get interesting is flying through the hurricane's rainbands and the eyewall, which can get a bit turbulent. The eyewall is a donut-like ring of thunderstorms that surround the calm eye. The winds within the eyeall can reach as much as 200 mph [325 km/hr] at the flight level, but you can't feel these aboard the plane. But what makes flying through the eyewall exhilarating and at times somewhat scary, are the turbulent updrafts and downdrafts that one hits. Those flying in the plane definitely feel these wind currents (and sometimes makes us reach for the air-sickness bags). These vertical winds may reach up to 50 mph [80 km/hr] either up or down, but are actually much weaker in general than what one would encounter flying through a continental supercell thunderstorm.
But once the plane gets into the calm eye of a hurricane like
Andrew or Gilbert, it is a place of powerful beauty: sunshine
streams into the windows of the plane from a perfect circle of
blue sky directly above the plane, surrounding the plane on all
sides is the blackness of the eyewall's thunderstorms,


... and directly below the plane peeking through the low clouds one can see the violent ocean with waves sometimes 60 feet high [20 m] crashing into one another. The partial vacuum of the hurricane's eye (where one tenth of the atmosphere is gone) is like nothing else on earth. I would much rather experience a hurricane this way - from the safety of a plane - than being on the ground and having the hurricane's full fury hit without protection.
The USAFR 53rd Hurricane Hunters have a 'cyber flight' through a hurricane. To try it CLICK HERE.
Contributed by Robert A. Black
There are no other planets known to have warm water oceans from which true water cloud hurricanes can form. However, many astronomers and planetary meteorologists believe Jupiter exhibits such storms, in which ammonia takes the place of water. The principal candidate is the famous Great Red Spot, and the numeous whorls that surround it. The Spot exhibits an anticyclonic circulation at its top, just as tropical cyclones do at the top of the troposphere.