Tropical Cyclone Centre La Réunion has started to issue track and intensity forecasts in 1990-1991 and has been designated by the World Meteorological Organization (WMO) as a Regional Meteorological Specialized Centre / Tropical Cyclone (RSMC/TC) in June 1993. The first official forecasts date from cyclone season 1993-1994.
Forecast numbers, forecast ranges, and the way to present the intensity forecasts have changed with time, with two main changes described in the table below.
| Cyclone season | Major changes | Track forecasts | Intensity forecasts |
| 1990-1991 | La Réunion starts issuing TC forecasts. | - at 12 and 24h ranges, 4 times a day (00, 06, 12, 18Z); - at 48h range, twice a day (00 and 18Z) |
Dvorak intensity forecast at 12, 24 and 48h ranges, twice a day (at 06 and 18Z) |
| 2003-2004 | Increase in the forecast number and in the forecast ranges and change in the presentation of the intensity forecast. | - at 12, 24, 36, 48, 60 and 72h ranges, four times a day (00, 06, 12 and 18Z) | Maximum winds (10-min average) and system type forecast at 12, 24, 36, 48, 60 and 72h ranges, 4 times a day (00, 06, 12 et 18Z). |
At the end of each season, accuracy of the RSMC forecasts is evaluated by comparison of the real-time official forecasts with the cyclone's best track (BT) database.
Best track database includes the analysis of all the significant tropical systems of the season, and consists of 6-hourly (00, 06, 12, 18Z) representative estimates of the tropical system's centre location and maximum wind as well as other parameters (intensity, size...), determined by a post-storm analysis of all available storm data.
Verification procedures are currently applied to track and intensity forecasts. Verifications concern "raw" forecast errors but also more sophisticated errors enabling identification of biases and objective assessment of the evolution of the forecast accuracy, as described below, in chapter 2.3.
Forecasts are verified only for the significant tropical systems (for which a best track has been elaborated). Procedures do not concern the weak systems, short-lived tropical disturbances or transient tropical depressions.
Every forecast on every system is verified (except the ones that can not be obviously verified due to the lack of data - for example when the BT stops before the forecast range), whatever the stage of the system intensity; i.e. even when a system is not considered as a tropical system but has become extratropical.
In addition, verifications are performed through Dvorak intensity stages stratification with the following thresholds: Ci ≥ 2.0, Ci ≥ 3.0, Ci ≥ 5.0, (Current intensity at the analysis). Therefore these specific verifications do not include cases when the system can not be "Dvorak analysed" (for instance, overland or extratropical systems).
Track forecast error is defined as the great-circle distance between a cyclone's forecast position and the best track position at the forecast verification time. This Direct Positional Error (DPE) can be projected along several axis to get the zonal (DX) or meridian (DY) components, or the components along and perpendicular to the track of the TC.
We define:
DX = error in the East-West direction. DX is positive if the forecast position lies eastward of the observed position.
DY = error in the North-South direction. DY is positive if the forecast position lies poleward of the observed position
AT = Error in the Along Track direction. AT is positive if the forecast position lies ahead of the observed position along the tropical cyclone track.
CT = Error in the Cross Track direction. CT is positive if the forecast position lies right of the observed track in the northern hemisphere and left of the observed track in the southern hemisphere.
The following diagram gives an explanation of these different forecast errors measurements.
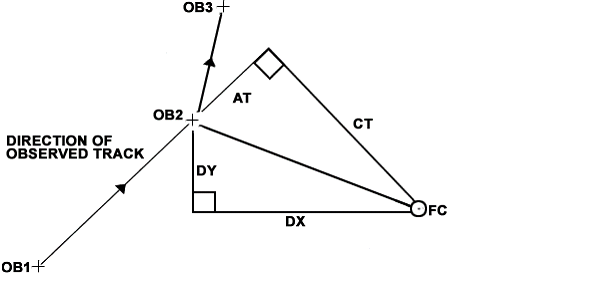
| OB1-3: | Observed positions |
| FC: | Forecast position: verifying against observation OB2 |
| DPE: | Direct positional error |
| DX: | Error in the East-West direction |
| DY: | Error in the North-South direction |
| AT: | Error in the Along Track direction |
| CT: | Error in the Cross Track direction |
Meridian bias gives information on whether the forecast errors resulted from a tendency to steer the storms poleward too soon.
AT errors give an indication of whether the forecasted TC motion is too slow or too fast and CT errors can be used to determine whether the forecast tends to recurve a TC too soon or fail to recurve it soon enough.
TC intensity can be defined by the Minimum Sea level Pressure (MSLP) at the centre of the system or by the maximum 10-min average wind close to the centre. RSMC La Réunion uses the maximum 10-min average wind to issue intensity forecasts. Forecast intensity error is hence defined as the absolute value of the difference between the forecast and best track maximum 10-min average wind at the forecast verifying time.
Forecast verifications are presented through a set of statistical products, including inter-annual time-evolutions (from a cyclone season to another).
In order to evaluate the true evolution of the quality of the forecasts and detect the related trends, one need to be able to compare in an objective and unbiased way the annual scores and performances.
Due to the natural fickle character of tropical cyclone tracks and the varying degree of difficulty of forecasting them, annual errors can indeed vary significantly from year to year. For example, years dominated by regular and rather rectilinear tracks typically have small annual errors. Conversely, years dominated by erratic tracks lead to larger errors.
Consequently, one must present the error characteristics in a really representative and consistent manner. To do so, several methods exist. Two of them are used at La Réunion.
The first one consists to smooth this natural variability by using a longer period of record in order to get a sample large enough to be considered more robustly homogeneous with time in terms of degree of difficulty of the forecasts. Therefore, the RSMC La Réunion is using a 5-year running-mean to display its forecast error characteristics.
The second one consists to quantify the forecast skill by comparison with a baseline or standard benchmark measure of skill serving as an "objective" reference. A model like a climatology-persistence one can be used as such. RSMC La Réunion has chosen the 12h-persistence as a skill baseline (this is the simplest model ever; a forecast is obtained by extrapolating to the other forecast ranges the tendency observed over the last 12 hours. For example, if a system has intensified from 30 to 45 knots over the 12 last hours, the forecast at range 24h will be at 75 knots).
A skill can therefore be calculated to know how better - or not (a skill can be negative) - is the forecast compared with the benchmark model. Thus the skill against persistence will be quantified in percentage as below:
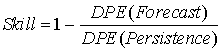
Skill must hence be considered as a complement of the "raw" forecast errors, helping to better evaluate them.
A season associated to small forecast errors and low skills was likely an easy season in terms of forecasting. Conversely, a season associated to small forecast errors but with high skills will unambiguously mean that the forecasts were excellent.
A season associated to above normal forecast errors and high skills means the season was difficult to forecast. Conversely, a season associated to above normal forecast errors but low skills means the forecasts were indeed very poor.